Dive Brief:
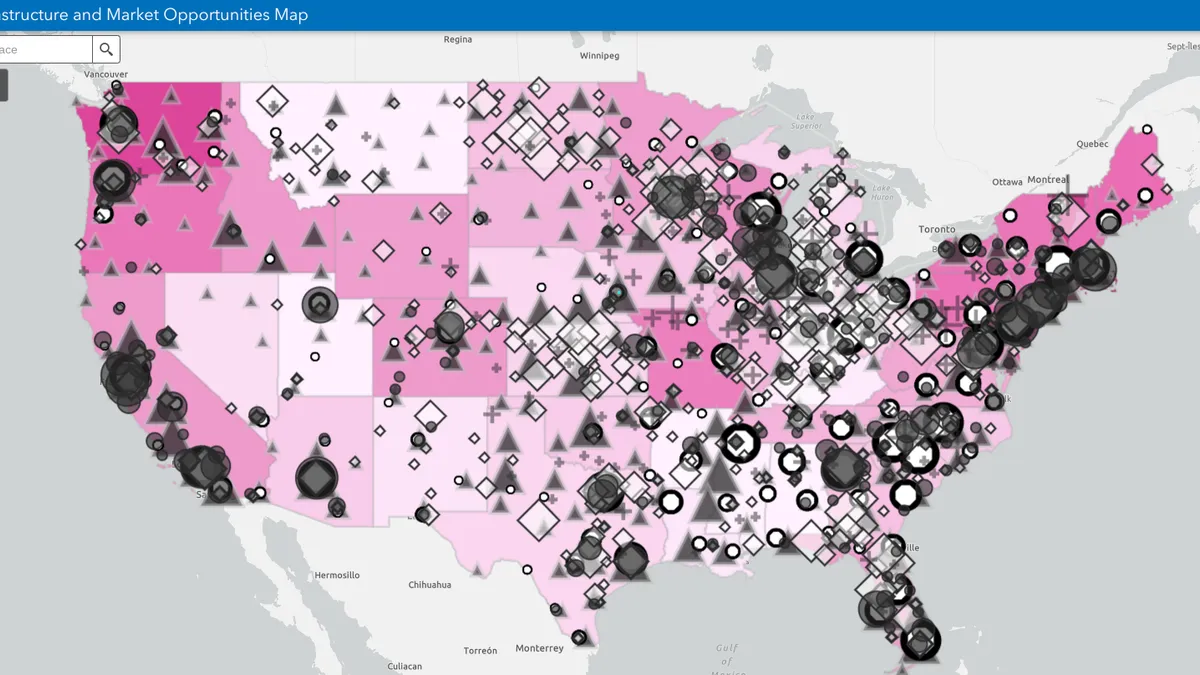
- The U.S. EPA is seeking feedback on its new interactive Recycling Infrastructure and Market Opportunities Map in an effort to make the nationwide mapping tool more complete, accurate and easier to use.
- The first iteration of the map includes locations of MRFs, composters, anaerobic digesters, transfer stations, secondary processing facilities, e-scrap facilities and other infrastructure. It also provides data on per capita generation and recycling for 16 material types, as well as other information on market influences such as bottle bills.
- The EPA sees potential for its tool to be a “comprehensive resource” for visualizing and mapping postconsumer markets and infrastructure, but it says it needs more input on what additional details will make the map more functional for the industry. It will take comments through June 26.
Dive Insight:
The map is part of a larger push for the EPA to gather more and better data about the inner workings of the waste and recycling industry. Data collection is a notable component of the National Recycling Strategy, a master plan the agency published in 2021 to guide the country toward a 50% recycling rate by 2030 and tackle larger themes of climate change, environmental justice and circular economy initiatives.
The EPA also linked the mapping project to the bipartisan Infrastructure Law and related grants for recycling infrastructure, and it mentioned the map rollout during its announcement in April about the EPA also working on a plastics pollution prevention strategy.
Recycling industry groups welcomed the first iteration of the map, saying it’s an important sign that the EPA is making good on its promise to deliver more data and resources meant to boost the domestic recycling economy.
Jesse Maxwell, advocacy and safety senior manager for the Solid Waste Association of North America, said SWANA has shared the map with members for their review and feedback. SWANA is not yet sure if it will share thoughts with the EPA on the current version, but it sees the map as a positive sign that the agency is working on “understanding the current state of recycling infrastructure and market opportunities in the United States” as part of the National Recycling Strategy, he said.
Other groups publish similar maps on more regional recycling markets, including the Southeast Recycling Development Council. That organization’s map covers recycling demand from manufacturers and businesses in Southeastern states.
“It's important that we measure our industry, and the EPA’s mapping tool is a step in that direction,” said Will Sagar, SERDC’s executive director. “It is very important that we know what resources we have and where they are.”
Sagar said it appears there could be a few updates made to EPA’s map when it comes to facilities and data in the Southeast, but he said the GIS mapping software the EPA uses from Esri is an ideal platform for layering many different types of data.
It’s unclear when or how the EPA plans to update or maintain its nationwide recycling market map, but Sagar acknowledges that maintaining similar databases takes hours of meticulous fact checking and analysis. EPA’s data sources range from information collected between 2011 to 2021, with most data from 2018-2021, the agency said.
SERDC aims to update its market map every few years and relies partly on funding from sources like the EPA to hire staff to help with the heavy lifting of updating locations and statistics. SERDC is in the process of planning its next update.
EPA’s map joins a host of other mapping tools the waste and recycling industry uses to track market data. The Foodservice Packaging Institute has its own map of end markets for packaging, for example, which it says was last updated in 2018. The Recycling Partnership maintains a map of residential MRFs it says it aims to keep up to date. Closed Loop Partners has a map of plastic recycling infrastructure in the U.S. and Canada. Meanwhile, Waste Business Journal recently updated its directory for waste processing and disposal sites such as landfills, waste to energy plants, MRFs and composting sites.
Time will tell how the EPA map will coexist with these and other resources from recycling and waste organizations. The EPA also has an environmental justice mapping tool, EJScreen, which landfill operators like WM, Republic Services and Waste Connections have used for company sustainability and environmental justice documentation.
Some lawmakers are also advocating for more recycling data collection resources through the Recycling and Composting Accountability Act, a bill that would ask the EPA to more formally collect many types of nationwide recycling and composting data and call for reports on topics such as end-market sales for recycled and composted commodities.


